每次处理数据时,缺失值是必须要考虑的问题。但是手工查看每个变量的缺失值是非常麻烦的一件事情。
missingno提供了一个灵活且易于使用的缺失数据可视化和实用程序的小工具集,使您可以快速直观地总结数据集的完整性。
1、首先安装程序包并加载:
pip install missingno

import missingno as msno
2、导入训练数据集
import pandas as pd
import numpy as ny

data=pd.read_csv("model.csv")
3、无效矩阵的数据密集显示
msno.matrix(data, labels=True)
可以快速直观地挑选出图案的数据完成
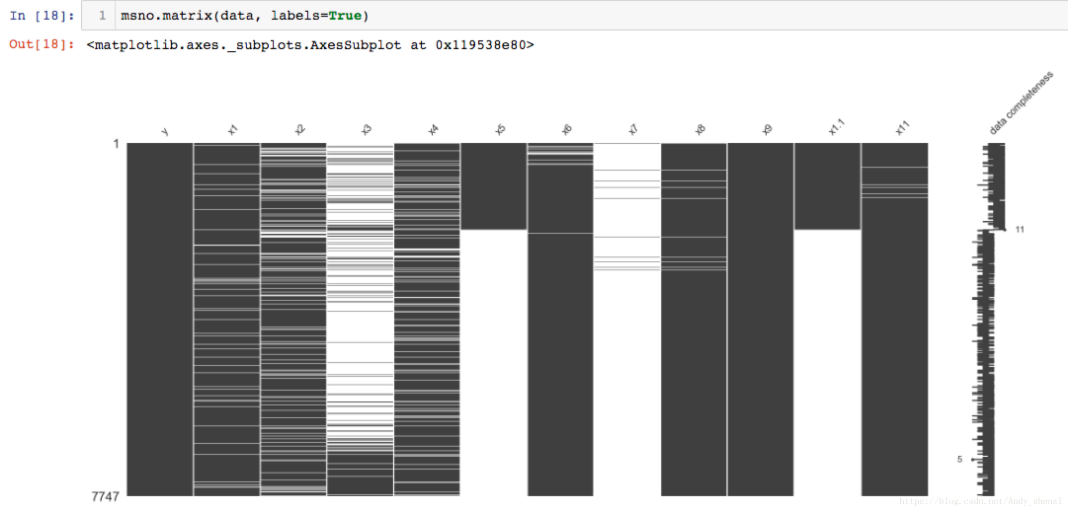
我们可以一目了然的看到每个变量的缺失情况,
变量y, X9数据是完整的,其他变量都有不同程度的缺失,
尤其是X3,X5,X7等的缺失非常严重
4、条形图
msno.bar(data)
msno.bar 是列的无效的简单可视化:
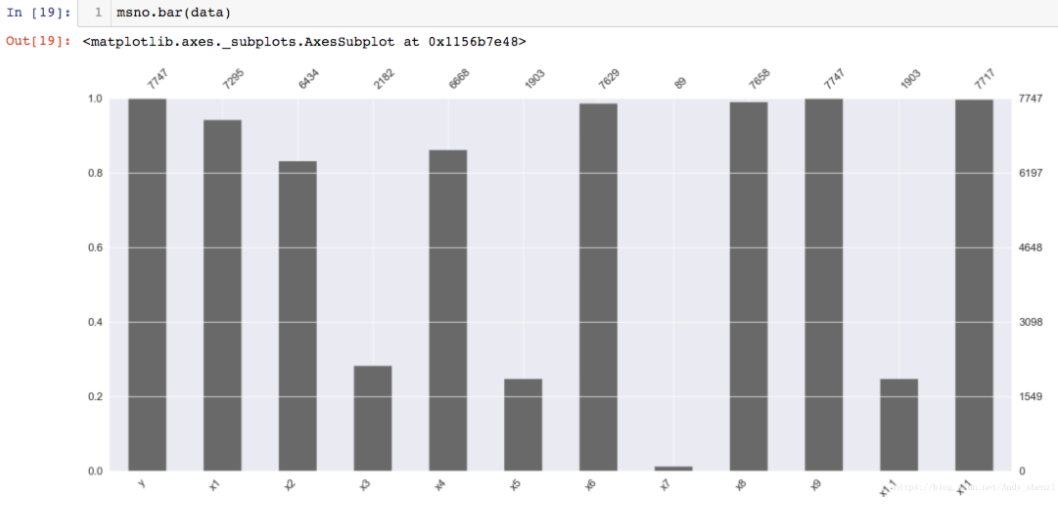
利用条形图可以更直观的看出每个变量完整性的比例和数量情况。
5、热图相关性
msno.heatmap(data)
missingno相关性热图措施无效的相关性:一个变量的存在或不存在如何强烈影响的另一个的存在:
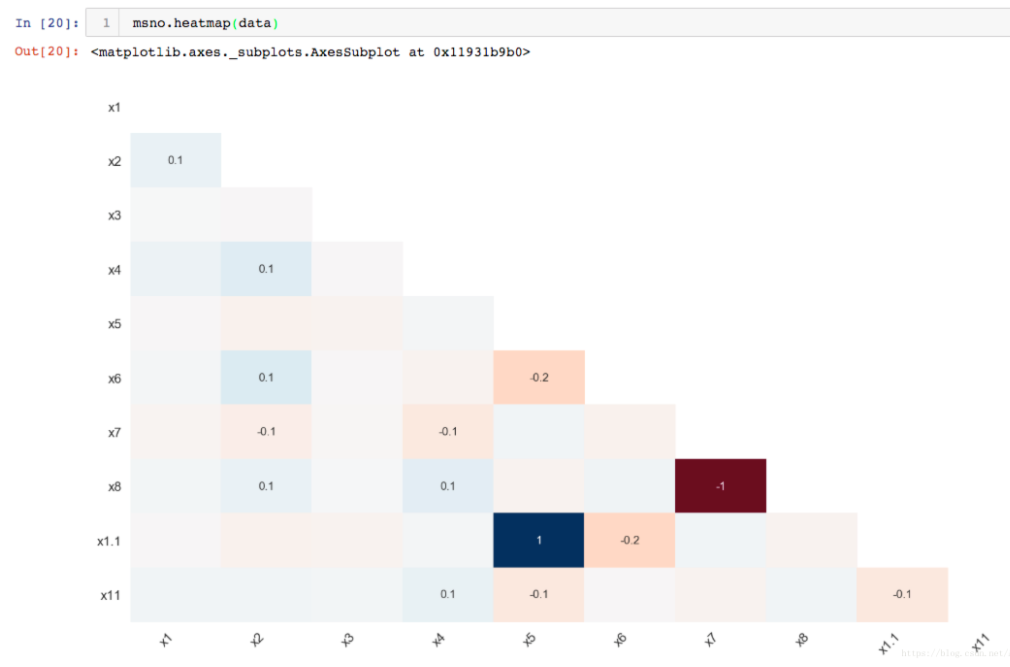
看到X5与X1.1的缺失相关性为1,说明X5只要发生了缺失,那么X1.1也会缺失,
X7和X8的相关性为-1,说明X7缺失的值,那么X8没有缺失;而X7没有缺失时,X8为缺失。
6、函数
def matrix(df,
           filter=None, n=0, p=0, sort=None,
           figsize=(25, 10), width_ratios=(15, 1), color=(0.25, 0.25, 0.25),
           fontsize=16, labels=None, sparkline=True, inline=False,
           freq=None, ax=None):
    """
    A matrix visualization of the nullity of the given DataFrame.
    :param df: The `DataFrame` being mapped.
    :param filter: The filter to apply to the heatmap. Should be one of "top", "bottom", or None (default).
    :param n: The max number of columns to include in the filtered DataFrame.
    :param p: The max percentage fill of the columns in the filtered DataFrame.
    :param sort: The row sort order to apply. Can be "ascending", "descending", or None.
    :param figsize: The size of the figure to display.
    :param fontsize: The figure's font size. Default to 16.
    :param labels: Whether or not to display the column names. Defaults to the underlying data labels when there are
    50 columns or less, and no labels when there are more than 50 columns.
    :param sparkline: Whether or not to display the sparkline. Defaults to True.
    :param width_ratios: The ratio of the width of the matrix to the width of the sparkline. Defaults to `(15, 1)`.
    Does nothing if `sparkline=False`.
    :param color: The color of the filled columns. Default is `(0.25, 0.25, 0.25)`.
    :return: If `inline` is False, the underlying `matplotlib.figure` object. Else, nothing.
    """
参考