sklearn.metrics.confusion_matrix用法
混淆矩阵
sklearn.metrics.confusion_matrix(y_true,
                                 y_pred,
                                 labels=None,
                                 sample_weight=None
                            )
参数:
y_true: array, shape = [n_samples] 是样本真实分类结果,y_pred: array, shape = [n_samples] 是样本预测分类结果labels:array, shape = [n_classes], optional 是所给出的类别,通过这个可对类别进行选择, 少数类在前,多数类在后sample_weight: 样本权重
返回值:
- C : array, shape = [n_classes, n_classes] Confusion matrix
coding
>>> from sklearn.metrics import confusion_matrix
# 三分类的情况
>>> y_true = [2, 1, 0, 1, 2, 0]
>>> y_pred = [2, 0, 0, 1, 2, 1]
>>> confusion_matrix(y_true, y_pred)
array([[1, 1, 0],
       [1, 1, 0],
       [0, 0, 2]], dtype=int64)

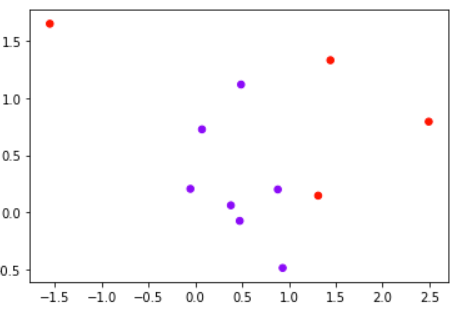
自建数据集
class_1_ = 7
class_2_ = 4
centers_ = [[0.0, 0.0], [1,1]]
clusters_std = [0.5, 1]
X_, y_ = make_blobs(n_samples=[class_1_, class_2_],
                    centers=centers_,
                    cluster_std=clusters_std,
                    random_state=0, shuffle=False)

plt.scatter(X_[:, 0], X_[:, 1], c=y_, cmap="rainbow",s=30)
建模,调用概率
from sklearn.linear_model import LogisticRegression as LogiR

clf_lo = LogiR().fit(X_,y_)
prob = clf_lo.predict_proba(X_)

#将样本和概率放到一个DataFrame中
import pandas as pd
prob = pd.DataFrame(prob)
prob.columns = ["0","1"]
使用阈值0.5,大于0.5的样本被预测为1,小于0.5的样本被预测为0
#手动调节阈值,来改变我们的模型效果
for i in range(prob.shape[0]):
    if prob.loc[i,"1"] > 0.5:
        # 添加新的标签列
        prob.loc[i,"pred"] = 1
    else:
        # 添加新的标签列
        prob.loc[i,"pred"] = 0

# 添加真实的标签列
prob["y_true"] = y_
prob = prob.sort_values(by="1",ascending=False)
使用混淆矩阵查看结果
from sklearn.metrics import confusion_matrix as CM

CM(prob.loc[:,"y_true"],prob.loc[:,"pred"],labels=[1,0])

#array([[2, 2],
#       [1, 6]], dtype=int64)