ExhaustiveFeatureSelector
ExhaustiveFeatureSelector(estimator,
                          min_features=1,
                          max_features=1,
                          print_progress=True,
                          scoring='accuracy',
                          cv=5, n_jobs=1,
                          pre_dispatch='2n_jobs',
                          clone_estimator=True)
用于分类和回归的穷举特征选择
参数 :
estimator: scikit-learn classifier or regressormin_features: int (default: 1)Minumum number of features to select
max_features: int (default: 1)Maximum number of features to select
print_progress: bool (default: True)Prints progress as the number of epochs to stderr.
scoring: str, (default='accuracy')Scoring metric in {accuracy, f1, precision, recall, roc_auc} for classifiers, {'mean_absolute_error', 'mean_squared_error', 'median_absolute_error', 'r2'} for regressors, or a callable object or function with signature
scorer(estimator, X, y).cv: int (default: 5)Scikit-learn cross-validation generator or
int
属性:
best_idx_: array-like, shape = [n_predictions]Feature Indices of the selected feature subsets.
best_feature_names_: array-like, shape = [n_predictions]Feature names of the selected feature subsets. If pandas DataFrames are used in the
fitmethod, the feature names correspond to the column names. Otherwise, the feature names are string representation of the feature array indices. New in v 0.13.0.best_score_: floatCross validation average score of the selected subset.
subsets_: dict在穷举选择过程中选择的特征子集的字典,其中字典键是这些特征子集的长度k。字典值是字典本身,具有以下键:“feature_idx”(特征子集的索引元组)“feature_names”(特征名称的元组)。subset)“cv_scores”(列出单个交叉验证得分)“avg_score”(平均交叉验证得分)注意,如果fit方法中使用pandas数据帧,则“feature_names”对应于列名。否则,特征名称是特征数组索引的字符串表示
方法:
fit(X, y, custom_feature_names=None, groups=None, fit_params)
进行特征选择并从训练数据中训练模型。
Parameters
X: {array-like, sparse matrix}, shape = [n_samples, n_features]Training vectors, where n_samples is the number of samples and n_features is the number of features. New in v 0.13.0: pandas DataFrames are now also accepted as argument for X.
y: array-like, shape = [n_samples]Target values.
fit_transform(X, y, groups=None, fit_params)
适应训练数据并从X返回最佳选择的特征。
Parameters
X: {array-like, sparse matrix}, shape = [n_samples, n_features]Training vectors, where n_samples is the number of samples and n_features is the number of features. New in v 0.13.0: pandas DataFrames are now also accepted as argument for X.
y: array-like, shape = [n_samples]Target values.
Returns
Feature subset of X, shape={n_samples, k_features}
get_metric_dict(confidence_interval=0.95)
Parameters
confidence_interval: float (default: 0.95)Return metric dictionary
Returns :一种字典,其中每个字典值都是一个以迭代次数(特征子集数)为长度的列表。与这些列表相对应的字典关键字如下:“feature_idx”:特征子集“cv_scores”索引的元组:具有单个cv分数“avg_score”的列表:cv平均分数的标准偏差“std_err”:cv分数平均值的标准差“ci_bound”:cv分数平均值的标准误差“ci_bound”:的置信区间界限简历平均分
案例
封装器之穷举特征选择
穷举特征选择(Exhaustive feature selection),即封装器中搜索算法是将所有特征组合都实现一遍,然后通过比较各种特征组合后的模型表现,从中选择出最佳的特征子集
导入相关库
#导入相关库
from mlxtend.feature_selection import ExhaustiveFeatureSelector as EFS
from sklearn.neighbors import KNeighborsClassifier
from sklearn.datasets import load_iris
加载数据集
#加载数据集
iris = load_iris()
X = iris.data
y = iris.target
穷举特征选择
#穷举特征选择
knn = KNeighborsClassifier(n_neighbors=3) # n_neighbors=3

efs = EFS(knn,
         min_features=1,
         max_features=4,
         scoring='accuracy',
         print_progress=True,
         cv=5)
efs = efs.fit(X, y)
查看最佳特征子集
#查看最佳特征子集
print('Best accuracy score: %.2f' % efs.best_score_)
#Best accuracy score: 0.97

print('Best subset(indices):', efs.best_idx_)
#Best subset(indices): (0, 2, 3)

print('Best subset (correponding names):', efs.best_feature_names_)
结果:
Best accuracy score: 0.97
Best subset(indices): (0, 2, 3)
Best subset (correponding names): ('0', '2', '3')
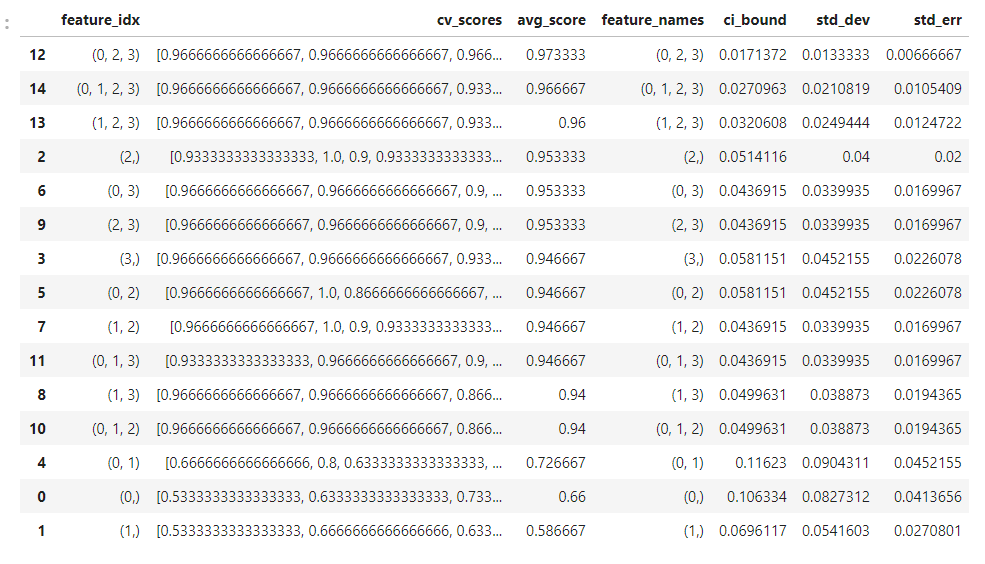
度量标准
#度量标准
efs.get_metric_dict()


import pandas as pd

df = pd.DataFrame.from_dict(efs.get_metric_dict()).T
df.sort_values('avg_score', inplace=True, ascending=False)
df
可视化
#可视化
import matplotlib.pyplot as plt

# 平均值
metric_dict = efs.get_metric_dict()
k_feat = sorted(metric_dict.keys())
avg = [metric_dict[k]['avg_score'] for k in k_feat]

# 区域
fig = plt.figure()
upper, lower = [], []
for k in k_feat: #bound
    upper.append(metric_dict[k]['avg_score'] + metric_dict[k]['std_dev'])
    lower.append(metric_dict[k]['avg_score'] - metric_dict[k]['std_dev'])

plt.fill_between(k_feat, upper, lower, alpha=0.2, color='blue', lw=1)

# 折线图
plt.plot(k_feat, avg, color='blue', marker='o')
plt.show()
参考:

.png)